4/2/21 After further analysis it has been determined that the Green Roof size would be 50,600 square feet to accommodate the entirety of the Green Roof to be placed on top of the building addition. The weight of the water remains the same per square foot at 30.836 psf. A drainage system was designed through SiphoniTec software. The system consists of 450 horizontal and 14 vertical feet of GA53 piping, and 4 12 Stack A5 drains, with 8.1x12.1 D2665 Reducers connecting the drains to the pipes. The system will be constructed in parallel in order to have each drain handle 12,650 square feet of drainage area coverage and 1.952 CFS. Because the 4 drains are in parallel, the system handles 7.8 CFS of flow which is adequate to the 6 CFS calculated through the HEC-HMS analysis and covers the entirety of the 50,600 square foot area of the Green Roof.
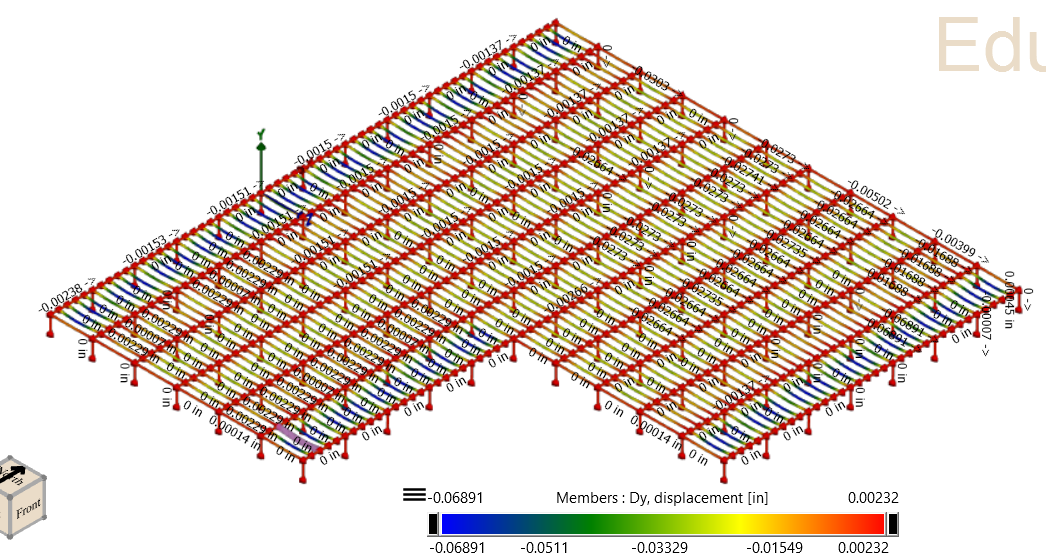
4/1/21: The visual analysis model has been completed with all inflicted loads included. The model showed that the building was stable with acceptable deflection in the members. The different loads modeled include live, dead, snow, and wind loads. The completed building uses an 8" concrete slab with #6 rebar spaced 6 inches, W16x77 beams, W30x90 girders, and HP18x135 columns. Larger columns than needed for the inflicted load were picked to prevent connectivity issues between the columns and girders. Pictured below is the Visual Analysis model of the building shown in result view, which shows deflection in the members.
3/25/21: After the preliminary information about the site was obtained, the modeling of the foundation began. The main model used for the analysis was SHAFT. SHAFT allowed for the soil layer data to be entered and a range of shaft diameters and lengths were able to be analyzed. The shaft for the final design will be computed upon an18 foot shaft, in which touches the top of the bedrock layer. After this analysis, the shaft properties obtained here were entered into a software called GROUP to analyze the lateral capacity.
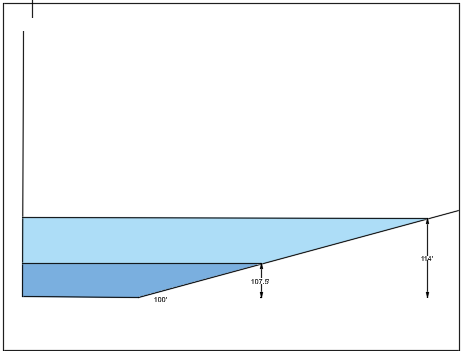
3/15/21: The detention basin can be seen in the figure showing the outlet structure elevations. The first circular orifice was placed at ground level or as shown at an elevation of 100 feet with a diameter of .9 feet. This was designed in accordance with the 2-year storm event. It will decrease the peak flow from 16 cfs to 8.1 cfs. The next outlet was placed at an elevation of 107.5 feet. With a diameter of .75 feet. This was designed to reduce the 10-year storm event peak flow to 19.1 cfs. Finally, at an elevation of 114 feet a rectangular weir was placed with a crest length of 5 feet to reduce the 100-year storm event to 38.3 cfs.
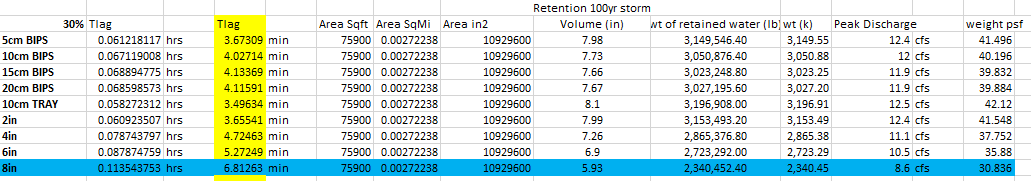
2/28/21: The 75,900 square foot Green Roof will have a depth of 8 inches. When the 8-inch intensive Green Roof design is selected, the volume of water during the 100-year rain event will be 5.93 inches with a peak discharge of 8.6 cfs. The 75,900 sqft roof is converted to inches and multiplied by the volume of water retained during the 100-year storm and by the weight of water. The weight of the water is 62.4 lb/ft3, which needs to be in terms of 0.0361 lb/in3 when plugged into the equation. The weight of the water retained in the green roof is attained through this method to yield the final result of a total of 2340.45 kips, which then needs to be divided by the total area of the Green Roof to have the result of the green roof weighing 30.836 psf.
2/20/21: The past month has been spent designing the slabs, beams and girders for the one story office building addition. The design load on the slab was found to be 602.64 lb/ft and the design moment was found to be 7533 lb*ft. The required steel needed for the 8 inch slab was found to be 1.4577 in^2 and the design chosen was #9 bars at 8” spacing. The final floor plan of the building is currently in the works to finalize all column, beam and girder placement. Once the layout is complete, the beam, girder, and column spacing, design load, and moment will be plugged in an excel sheet that was made to automatically select the best members for each, checking for deflection.
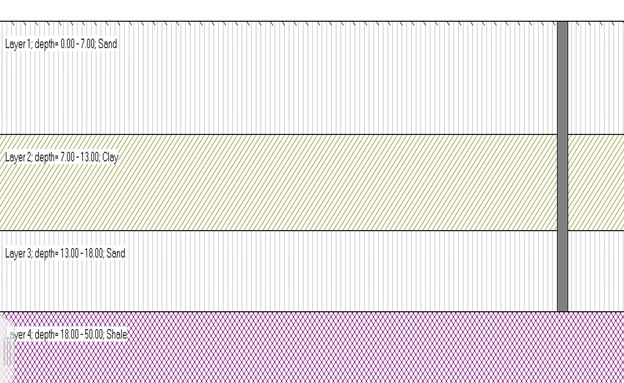
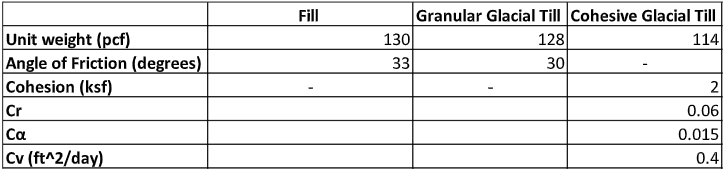
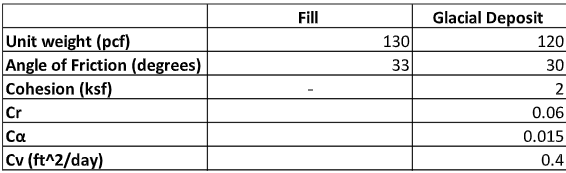
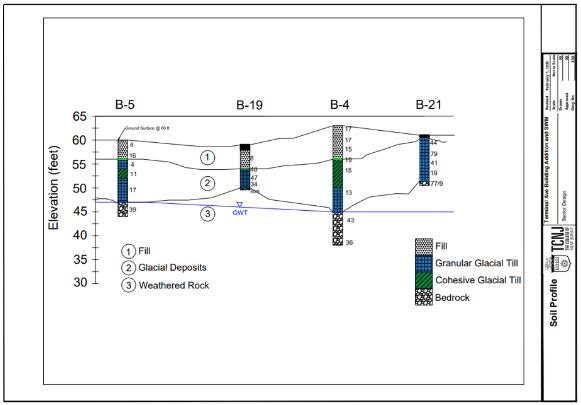
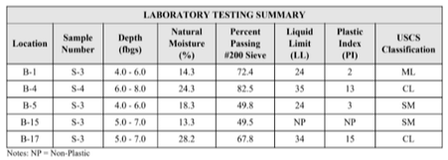
12/1/20: The boring logs and report were delivered from the company that did the testing. The laboratory tests done were on all classified soils on-site. The classified soils on site were identified through the USCS classification system and were silty sand (SM), sandy silt (ML), and clay (CL). From the boring logs and laboratory testing results, the design soil properties were found along with other design factors. The design properties were solved for through the soil profile, obtained through the boring logs. The groundwater and bedrock depths were obtained through the boring logs. For the granular soils, the unit weight and the angle of friction were found. For the cohesive soil, the unit weight and the compression properties. A table of the soil properties by stratum and layer are shown below, along with the soil profile.
11/20/20: To select the best design for the client, a decision matrix was created. Each design was ranked using different weighted criteria to find the highest scoring solution, like cost, construction time, and the realistic and design constraints. After analyzing the three alternative designs, the optimal design was selected. Alternative Design 1 proved to be the most efficient and effective solution for the clients needs. It consists of a 95,000 square foot addition on the south east side of the building to accommodate the company's growing operations. This addition will act as office space while the existing building will be renovated to hold all laboratory and laboratory support space. A new storm water management system will be put in place along with a green roof on the addition.
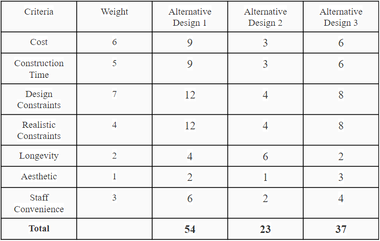
Decision Matrix
|
11/16/20: In order to summarize this semester's work and to properly estimate the engineering cost of the project, a schedule was made. The schedule was developed according to the estimated time it took to complete each task along with the actual time it took to complete each task. All substantial tasks that contribute to the completion of the project were included, like alternative design research, all presentations given throughout the semester, and all reports written. After the schedule was made, the engineering cost estimation was created for the project in order to bill the client for the work performed. The cost estimation includes work already performed this semester by all team members and advisors, and the estimated work to be done next semester at standard salary rates. Along with salary's, the overhead cost and fix cost both contributed to the final project cost.
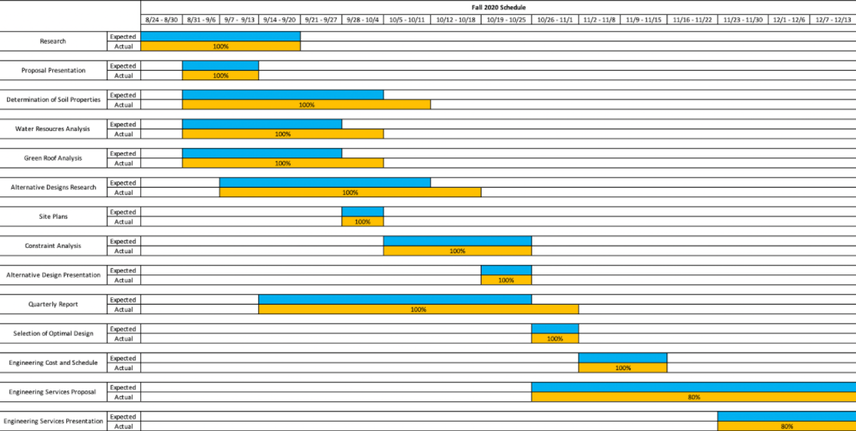
Fall Semester Schedule
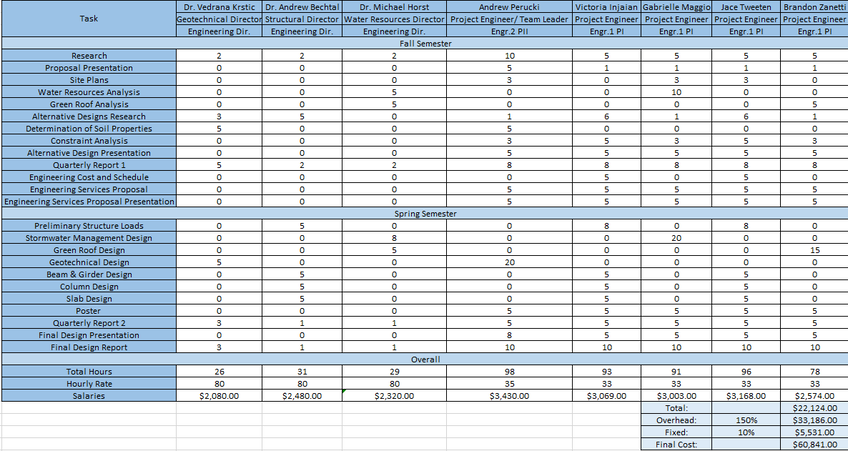
Engineering Project Cost
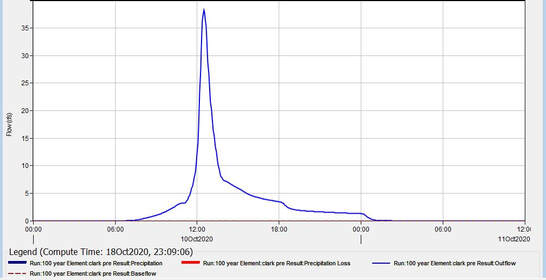
10/30/20: Due to the previous flooding in the parking lot and the additional impervious area being added from the building addition, a stormwater management facility has been requested. The engineering team has identified the post-construction unit hydrograph and peak flow data to aid in the analysis of the stormwater management design requested, as seen below. Depending on the addition of the impervious area added from the building and new parking lot's extension, there will be an increase in peak flow data. The pre-construction conditions show a peak flow data of 38.3 CFS. With the determination of structural alternatives, the post-construction hydrograph may be formed, along with the peak flow data. The stormwater management structures under evaluation are a detention basin and best management practice or BMP.
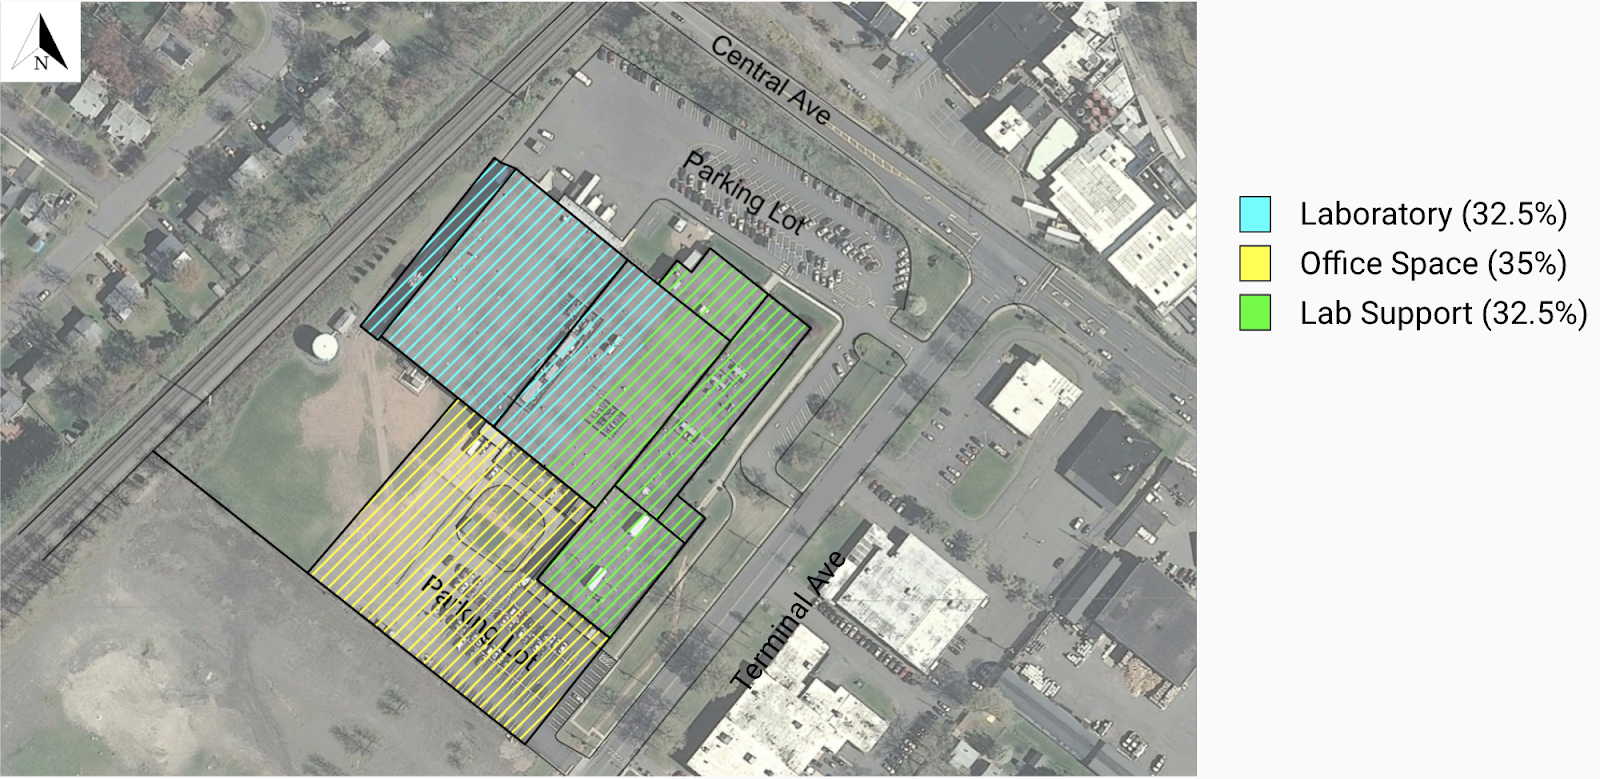
10/21/20: The team selected the three alternative designs for the project to be picked be selected from. Each design will be analyzed in a decision matrix to find the best design for the client. Alternative Design One was a single story, 95,000 sq ft addition of office space on the southside of the addition where the existing parking lot is. This would serve s an office space and the existing building would be turned into an even split between laboratory and laboratory support space.
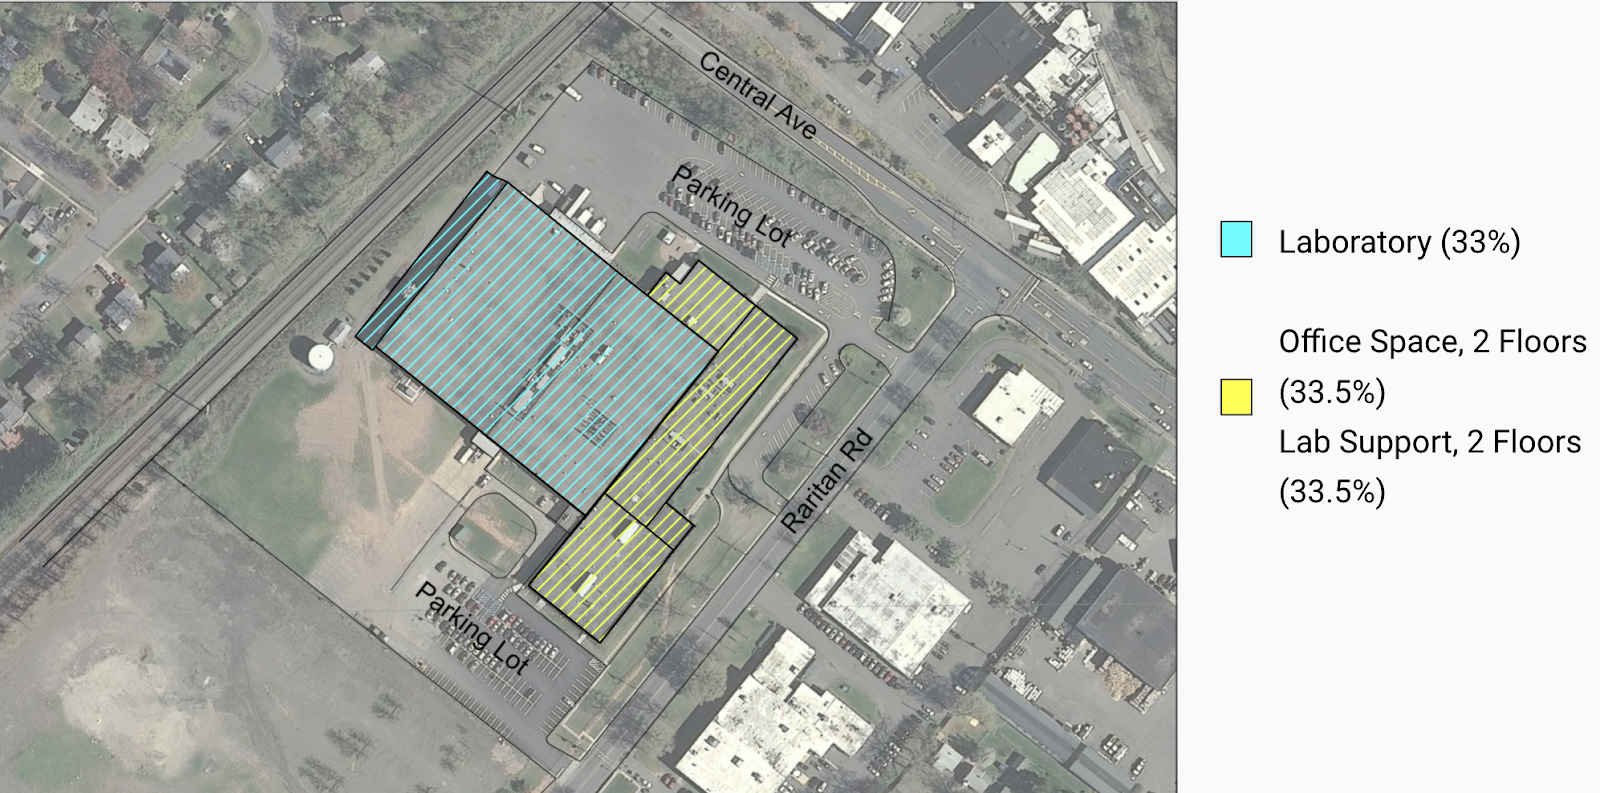
Alternative Design Two was a three story, 156,000 sq ft addition on the existing south east side on the building. The bottom two floors would serve as laboratory support and the top two as office space.
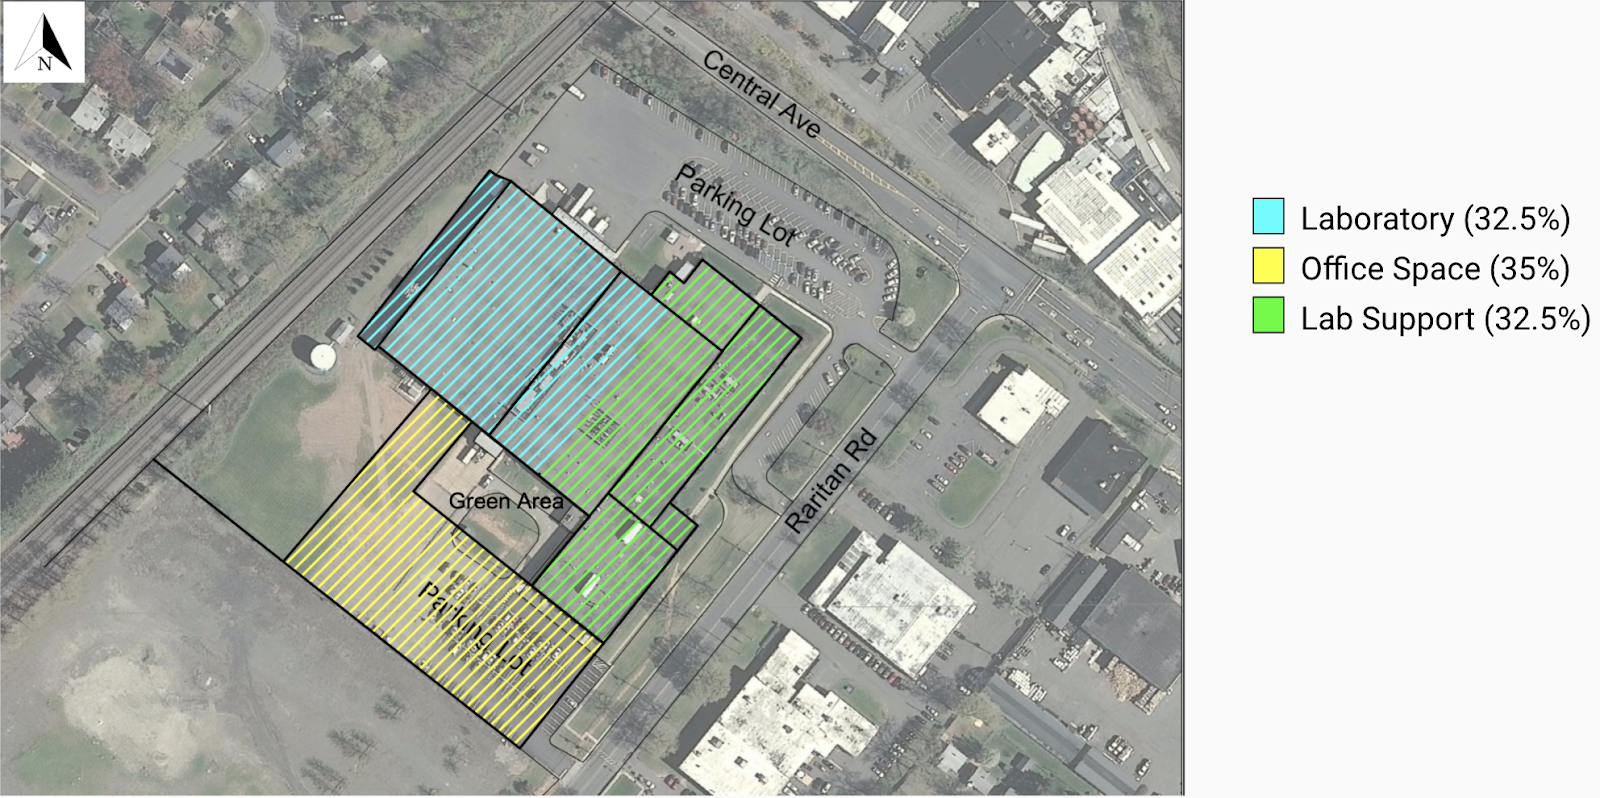
Alternative Design Three was a one story 95,000 sq ft building on the southside. This design incorporates a courtyard between the existing building and new addition as a green area for employees, and a glass walkway between the buildings as an aesthetic element to the design. Designs One and Three included green roofs as a part of their design. The figure below shows all three designs in order with their ratio of laboratory, laboratory support, and office space.
Alternative Design Two was a three story, 156,000 sq ft addition on the existing south east side on the building. The bottom two floors would serve as laboratory support and the top two as office space.
Alternative Design Three was a one story 95,000 sq ft building on the southside. This design incorporates a courtyard between the existing building and new addition as a green area for employees, and a glass walkway between the buildings as an aesthetic element to the design. Designs One and Three included green roofs as a part of their design. The figure below shows all three designs in order with their ratio of laboratory, laboratory support, and office space.
|
|
|
|
9/30/20: Looking at this data, our engineering team has determined the location of the groundwater table, type of soil, and soil grade. Our geotechnical lead, Andrew Perucki, has determined the majority of soil to be silty sand. The groundwater table ranged from 9-25 ft below the ground surface. The groundwater tends to sit near bedrock, for the design the groundwater will be considered deep. There was perched or trapped water on-site that caused some saturation in soil. This is a good sign for the usability of the soil so offsite material won't be needed. The area that will contain the western building addition has an elevation change of 15 ft. The area that will contain the easterm building addition has an elevation change of one foot. Additional soil properties are still being determined along with initial and alternative designs.
9/28/20: The engineering team has obtained data from Whitestone Associates Inc. that detail out the boring logs and subsurface profile of the existing site. The team has also received Whitestone’s initial report which includes a detailed layout of the project information (i.e topography description, boring locations). Whitestone has performed several different tests to determine the physical properties of the soil. A total of 21 soil test borings, 10 soil profile pits, and two test pits were conducted throughout the landscape of the property.
9/28/20: The engineering team has obtained data from Whitestone Associates Inc. that detail out the boring logs and subsurface profile of the existing site. The team has also received Whitestone’s initial report which includes a detailed layout of the project information (i.e topography description, boring locations). Whitestone has performed several different tests to determine the physical properties of the soil. A total of 21 soil test borings, 10 soil profile pits, and two test pits were conducted throughout the landscape of the property.
|
9/21/20: Website has officially gone live. Stay tuned for more updates to come regarding our progress.
